Popular JavaScript Charts and Graphics library such as jQuery, MooTools, Prototype, Dojo and YUI can great for accomplishing common JavaScript tasks. These libraries provide great functions that relate to graphics 3D, charts, bar, line, area and much more. And if one of these libraries can’t do the job, a plug-in probably exists that can.
JavaScript Charts and Graphics library is usually a wise decision, you may want to perform a task that can accomplished by a small library dedicate exclusively to this task or that are not supported by the most popular JavaScript libraries. JavaScript library and tools have make the lives of designers and developers quite easy because it are really fast and convenient to use
It is extremely important Javascript Charts and Graphics for web designers and Web developers to see useful JavaScript Charts and Graphics library that can make their lives easier. Find high quality tools, framework or library and effective is not an easy task, but in this post it specially show you popular Javascript Charts and Graphics Library with good quality. Please enjoys:
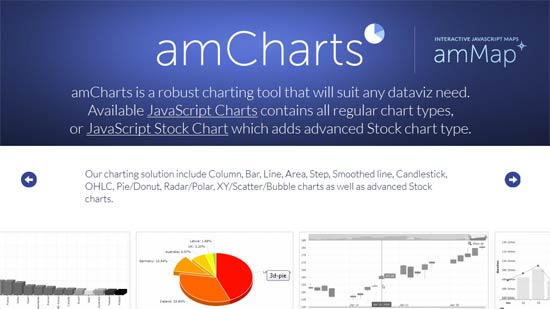
amCharts
amCharts or Quick-Charts is free, open source (licensed under MS-PL) charting controls for WPF & Silverlight. amCharts is a nice charting tool that will suit any dataviz need. Charting solution include Column, Bar, Line, Area, Step, Smoothed line, Candlestick, OHLC, Pie/Donut, Radar/Polar, XY/Scatter/Bubble charts as well as advance Stock charts.
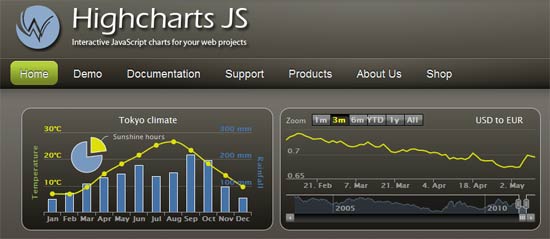
Highcharts
Highcharts is a charting library written in pure HTML5/JavaScript, offering intuitive, interactive charts to your web site or web application. Highcharts currently supports line, spline, area, areaspline, column, bar, pie, scatter, angular gauges, arearange, areasplinerange, columnrange, bubble, box plot, error bars, funnel, waterfall and polar chart types.
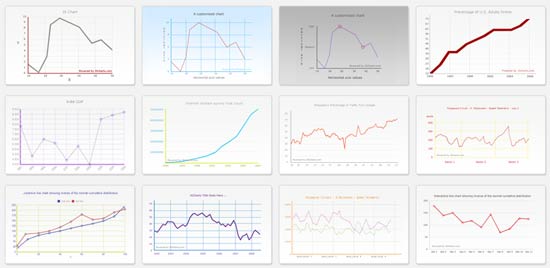
JS Charts
JS Charts is a JavaScript based chart generator that requires little or no coding. With JS Charts drawing charts is a simple and easy task, since you only have to use client-side scripting (i.e. performed by your web browser). No additional plugins or server modules are required. Just include our scripts, prepare your chart data in XML, JSON or JavaScript Array and your chart is ready!
D3.js – Data-Driven Documents
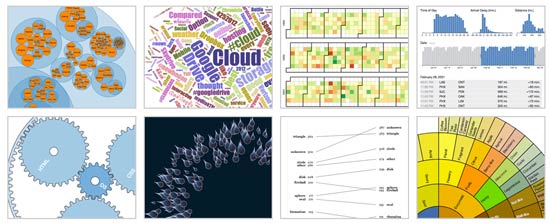
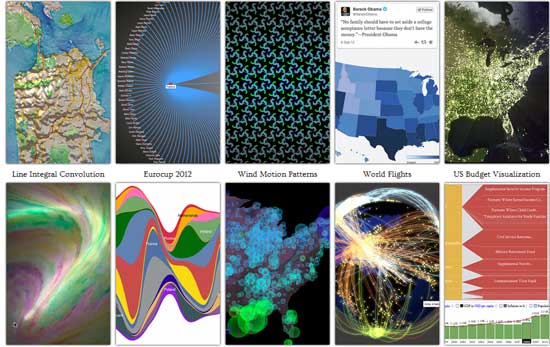
D3.js is a JavaScript library for manipulating documents base on data. D3 helps you bring data to life using HTML, SVG and CSS. D3’s emphasis on web standards gives you the full capabilities of modern browsers without tying yourself to a proprietary framework, combining powerful visualization components and a data-driven approach to DOM manipulation.
JavaScript InfoVis Toolkit
The JavaScript InfoVis Toolkit provides tools for creating Interactive Data Visualizations for the Web. The toolkit implements advance features of information visualization like TreeMaps, an adapted visualization of trees base on the SpaceTree, a focus+context technique to plot Hyperbolic Trees, a radial layout of trees with advance animations (RGraph) and other visualizations.
KineticJS
KineticJS is an HTML5 Canvas JavaScript framework that enables high performance animations, transitions, node nesting, layering, filtering, caching, event handling for desktop and mobile applications, and much more.
three.js – JavaScript 3D library
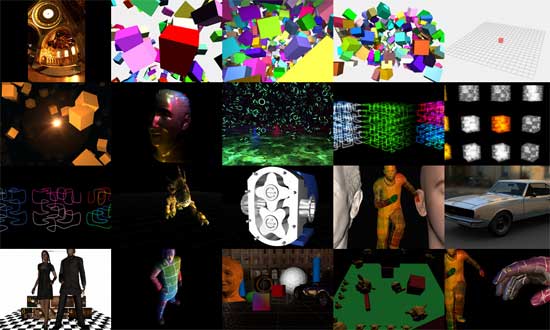
Three.js is a lightweight cross-browser JavaScript library/API used to create and display animated 3D computer graphics on a Web browser. Three.js scripts may be used in conjunction with the HTML5 canvas element, SVG or WebGL.
Exhibit Framework
Exhibit – Publishing Framework for Data-Rich Interactive Web Pages, Exhibit lets you easily create web pages with advance text search and filtering functionalities, with interactive maps, timelines, and other visualizations.
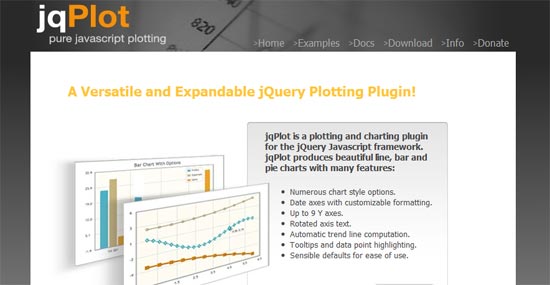
jqPlot Charts and Graphs for jQuery
jqPlot is a plotting and charting plugin for the jQuery Javascript framework. jqPlot produces beautiful line, bar and pie charts with many features
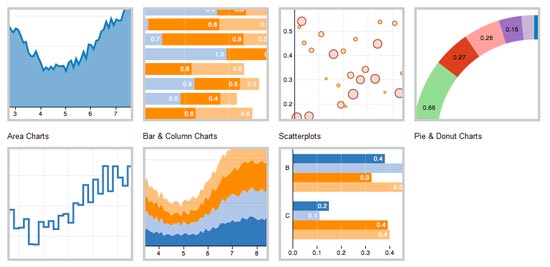
Protovis – A graphical approach to visualization
Protovis is free and open-source, provided under the BSD License. It uses JavaScript and SVG for web-native visualizations; no plugin required (though you will need a modern web browser)! Although programming experience is helpful
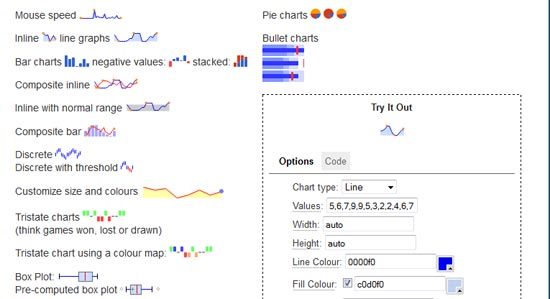
jQuery Sparklines
This jQuery plugin generates sparklines (small inline charts) directly in the browser using data supplied either inline in the HTML, or via javascript. The plugin is compatible with most modern browsers and has been test with Firefox 2+, Safari 3+, Opera 9, Google Chrome and Internet Explorer 6, 7, 8, 9 & 10 as well as iOS and Android.
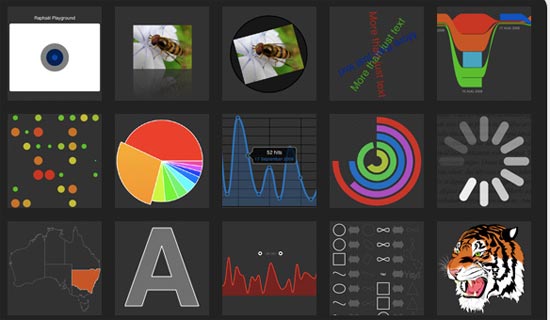
Raphaël—JavaScript Library
Raphaël is a small JavaScript library that should simplify your work with vector graphics on the web. If you want to create your own specific chart or image crop and rotate widget, for example, you can achieve it simply and easily with this library.
Timeplot Web Widget for Plotting Time Series
Timeplot is a DHTML-based AJAXy widget for plotting time series and overlay time-based events over them (with the same data formats that Timeline supports



Provotis is the predecessor of D3 and no longer under development.
Another thing worth mentioning is dc.js as it is pretty amazing.
http://nickqizhu.github.io/dc.js/
It uses D3 and crossfilter to create amazing dynamic charts.
A good tutorial can be found here :
https://becomingadatascientist.wordpress.com/tag/dc-js/
I think the best and faster way for charts, is Google Chart Api 🙂
Too easy to use.