
If you're looking for a way to make your data visualizations pop, then you need to check out HTML CSS graph bar and pie charts. These charts are easy to create a pie chart and add a touch of flair to your website or presentation.
Free CSS Graph Bar Pie Chart
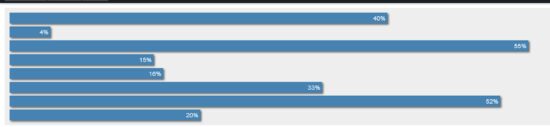
HTML Graphs with Horizontal Bar Chart
This was the attempt of my hack day to try to make a meaningful graphical representation using only HTML elements. The horizontal bar chart works very accurately, but the bubble table is not due to the central position of the square (with radius of border) not in the center. From this learning, I developed a model system based on SVG, much easier to use.

Responsive SVG graph
The graph line and (after a short delay) labels and tick marks remain undistorted as the graph resizes with the window. Lovely. (Though my iffy formatting means the labels may be cropped if the window's tiny, as here on CodePen. Oops.)

Charts pure Css

Morris.js charts

Chart.js Gradients

AngularJs + d3Js + bar chart example
Horizontal Stacked Bar Chart

CSS Bar Chart Using HTML5 Progress

Responsive and Animated Pie Charts
It is a simple css pie chart.

Animated Stats and graph

CSS3 Animated Graph
Pure HTML and CSS3 line graph. Hovering a section highlights it with a caption. Populated and updated on an interval with AngularJS. A rotation transform is manually applied to connect the dots, and a simple CSS3 transition provides the animation.

Dynamic Line Graph w/ Raphael.js
It is a sample flexible, dynamic line graph that used a custom data object and Rahael.js to bring this about. There are solutions out there link hightcharts, but they are fairly cumbersome, don't offer a good way to fully customize the design and are filled with features you don't need.

Dashboard Graph
Early concept graph for an admin dashboard. Toggles between team overview and the individual user's data. Values are calculated based on the data, and markers are adjusted accordingly.

Simple AngularJS Graph
It always struck me that Angular could be used as a nice simple tool for visualising data. The ability to use Angular data values in inline style would allow for bar charts, graphs or pie charts to be created quite simply.

Animated Data Bar Chart & Graph
An interactive bar graph packed with animations and information. Built with CSS and jQuery.

d3 linegraph
A d3 line graph with additional “horizontal padding” to the chart area.

Bar Chart with JS

CSS 3D Animated Chart
3D prisms created purely with HTML and CSS3(D) transforms, shaded with CSS gradients, animated with CSS transitions. AngularJS is used to wire up an updating dataset.

CSS3 Pie Chart
Pure CSS3 experimental charts, no JavaScript & zero image. Best viewed in Webkit browsers.

Circle Bar Chart
Animated circle bar chart created with D3.

Ishtar Interactive Line Chart

SVG Doughnut chart with animation and tooltip

Radar Chart jQuery Plugin

D3 Line Chart Plotting Shot Attempts
D3 line chart plotting shot attempts for an NHL hockey game. Different point styling for goals vs. shots, tooltip on hover & additional details show on click. Optional strength chart toggle which underlays 5v4, 4v5 and 5v5 events during the game.

Animated bar chart
Simple animated bar chart. This could be made purely in CSS once there is support for using attr() with the “height” property. This is proposed and should work in the future, though

Dynamically generated 3D bar chart

D3 Charts

SVG Pie chart with tooltip and mouse effects

Canvas pie chart with CSS bar chart fallback

Bullet Chart Example

Multiple Chart Example

Animated chart with jQuery
Animated bar chart from existing HTML table

Canvas PieChart

Playing with Mustache and Google Chart

CSS Vertical Chart

Adjustable Pie Chart

Make Google Charts Responsive
How to make Google charts play nicely in responsive mode (as in auto adjusting to window width). By default Google charts display nicely upon reload, but not when resizing the window.

Basic Range Chart Example

Basic Dotplot Example

Grouped Bar Example

CSS3 Line With Data Labels Example

Dotplot With Range Example

Scatterplot With Annotations Example

Slopegraph Example

Basic Boxplot Example

Multiple Line Example

Playing with Google Charts
My attempt at making Google Charts look better. If anyone figures out an easy way to style them with CSS, let me know.

Line Chart with Chart.js

Customisable Animated Donut Chart
Few lines of code to create animated Donut charts. Their size and the thickness of their strokes can be easily edited via CSS. The javascript will do the rest!

JS Pie Chart V2

Responsive CSS Bar Graph

Triple Doughtnut Chart

d3 bounded-zoom line chart example

3D Animation Chart Bar

Dash Board Chart

Animated Dashboard Widget

Cloud storage ui

HTML 5 Canvas Polar Clock

Country Bar Chart 3D

D3.js bar chart with transitions

jQuery Donut Chart Widget

Html CSS Graphs

Animated 3D Bar charts
This animated and 3D bar charts are created using pure css and a few animations

